
Page 238 - Pure Life 31
P. 238
The Effect of Public Service and Leadership on… K. Kuswanto et al / (237
The data were analyzed of public services can be
using multiple regression seen in the following table:
statistical techniques after
fulfilling the analysis
prerequisite tests, namely
normality test, multicollinearity
test, and heteroscedasticity test.
Results and Discussion
1. Description of Public
Service
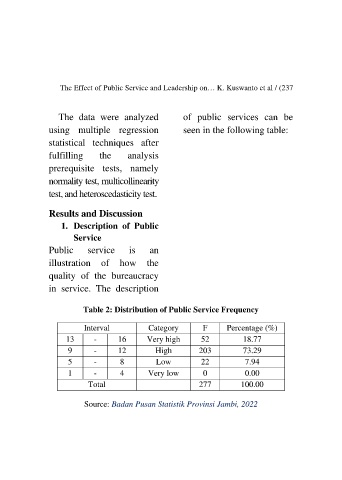
Public service is an
illustration of how the
quality of the bureaucracy
in service. The description
Table 2: Distribution of Public Service Frequency
Interval Category F Percentage (%)
13 - 16 Very high 52 18.77
9 - 12 High 203 73.29
5 - 8 Low 22 7.94
1 - 4 Very low 0 0.00
Total 277 100.00
Source: Badan Pusan Statistik Provinsi Jambi, 2022